Rating Color in Pears
This module will determine the color on a piece of fruit.
Segmentation for Pear Color Rating
Prior to running this module, Step 2: Run Segmentation must be performed so that pears on the tray can be separated into individual images. To follow along with this tutorial, you can use the following image:
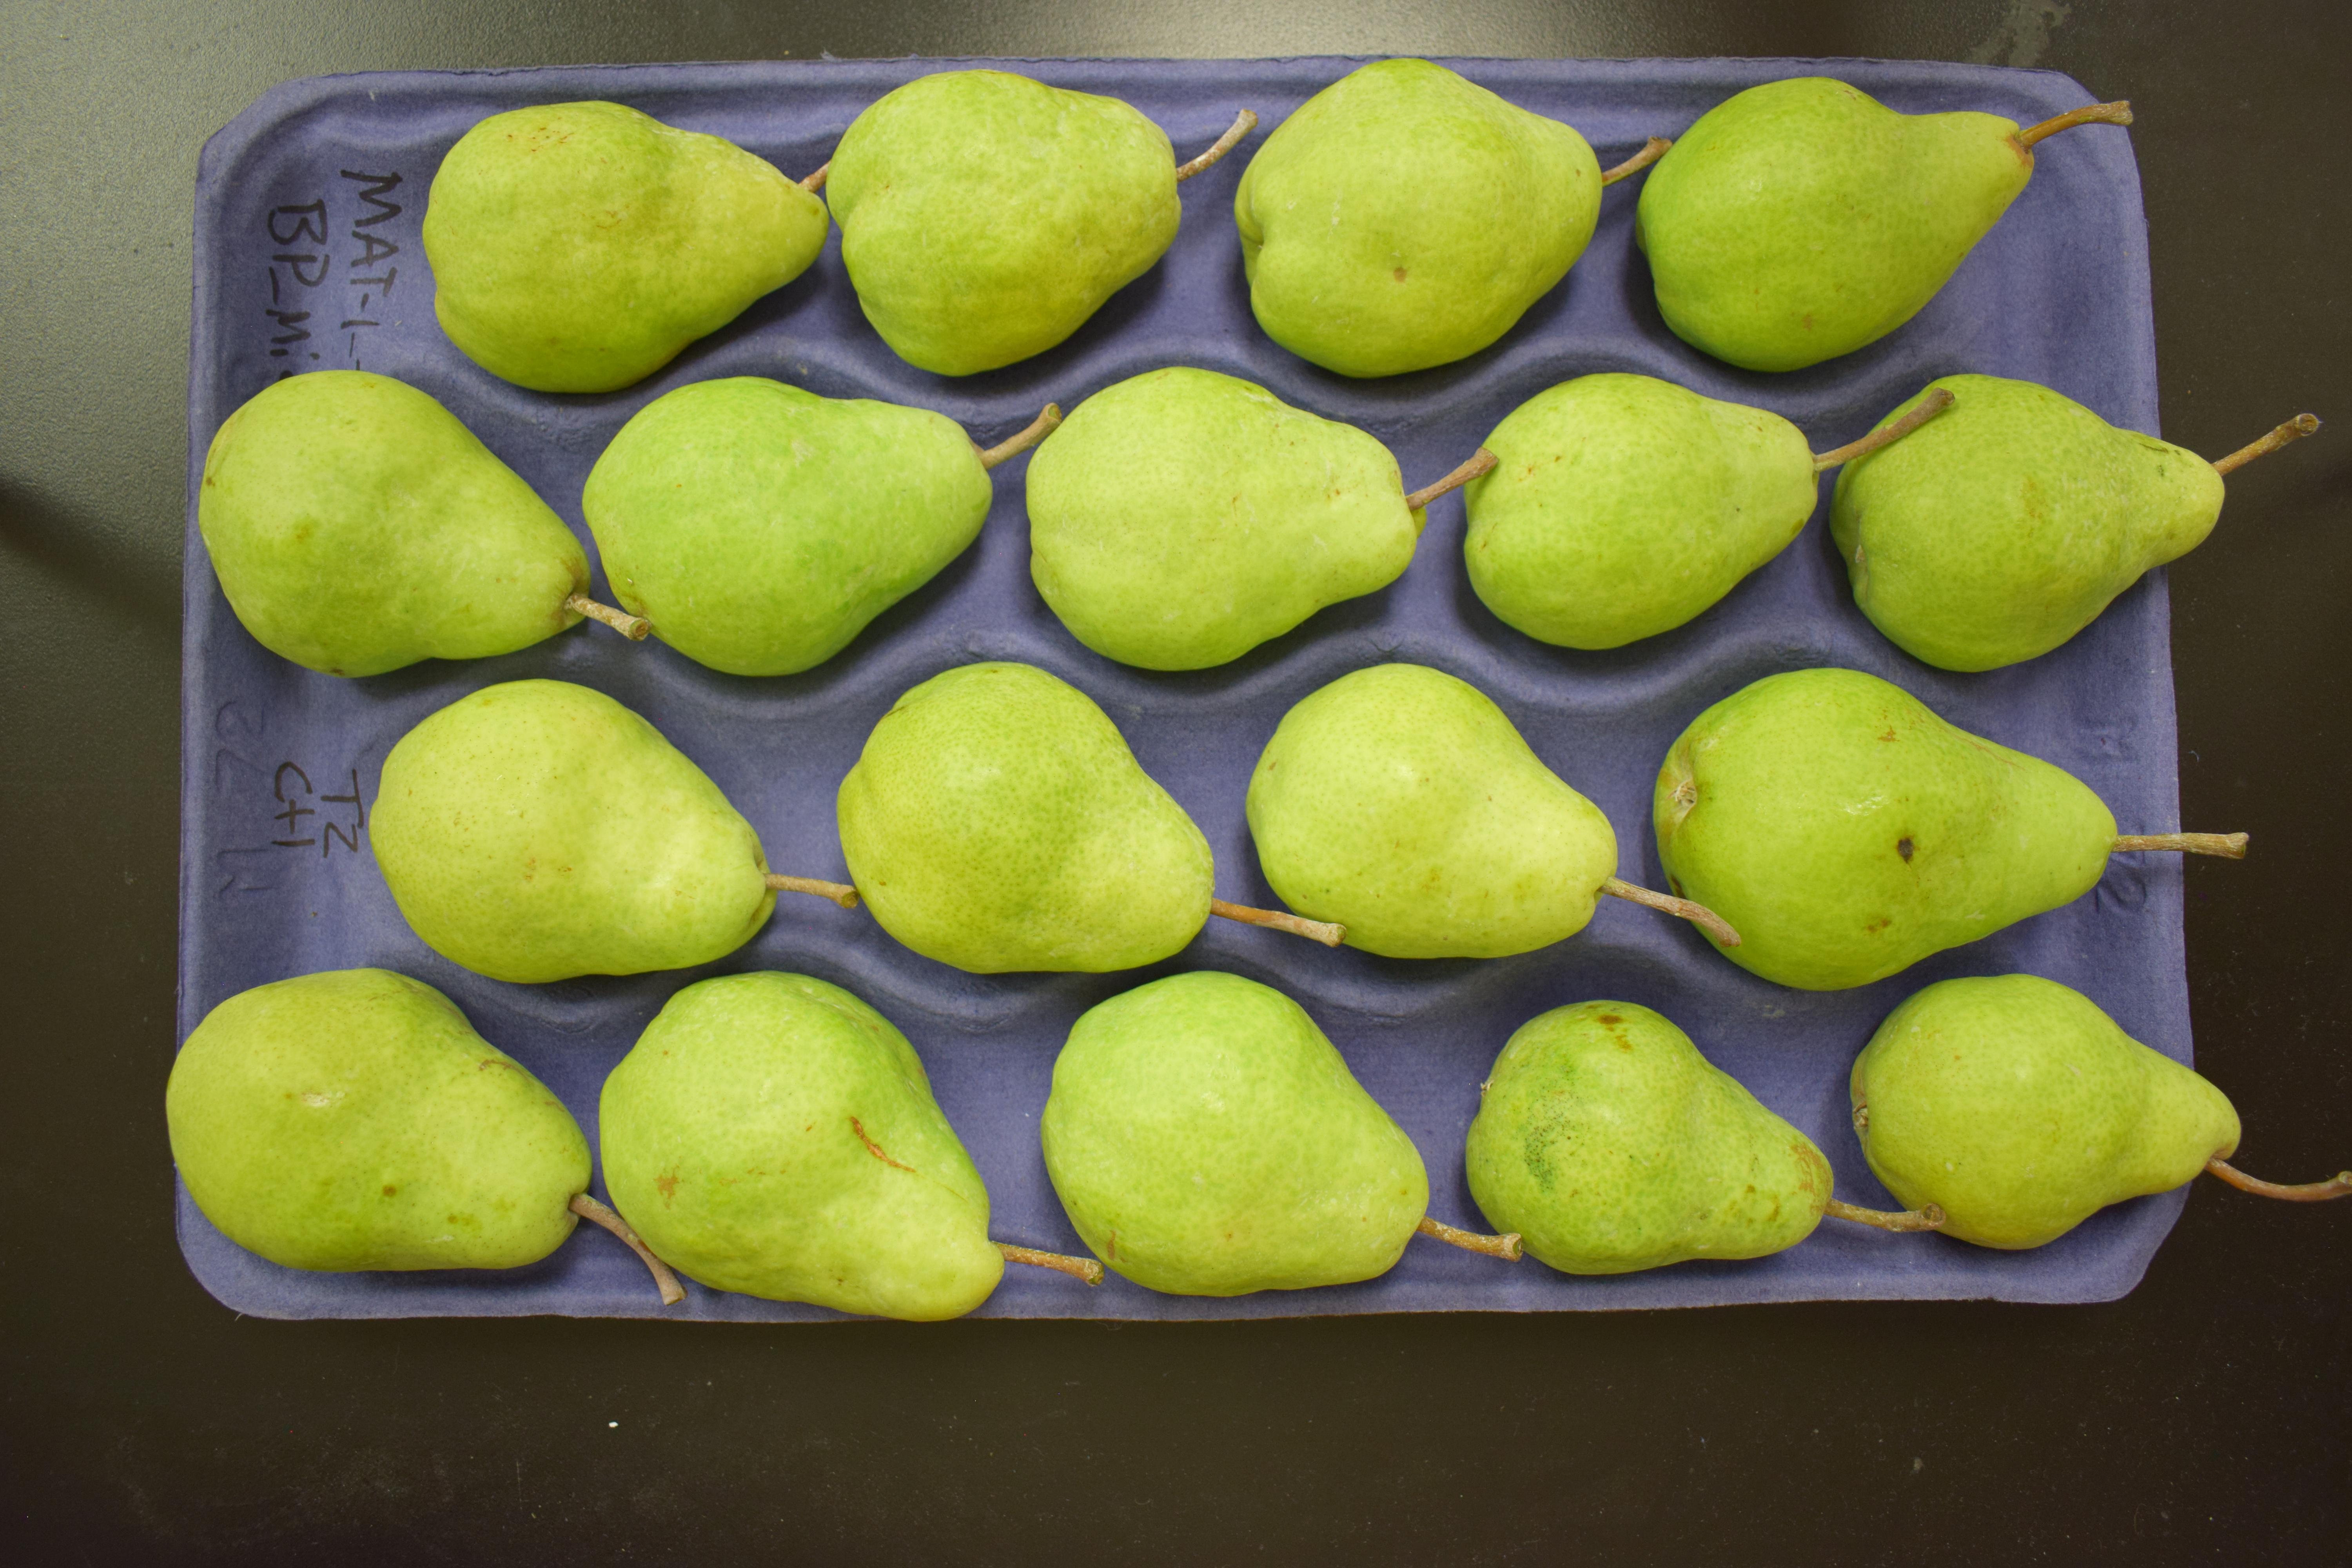
Demo image for pear color analysis.
Rate Pear Color
Inside of your Granny project directory (created in the Step 1: Project Setup), you should have performed the segmentation step before proceeding with pear color analysis. Now, you will run the color analysis on the command-line. Like the segmentation step, you must provide several arguments. The following table lists the arguments needed for the color analysis:
Granny Options |
Description |
|---|---|
|
Indicates you want to use the command-line interface. |
|
Indicates you want to run the color analysis. |
|
The directory where the segmented images of apple cross-sections, stained with iodine are kept. |
Similar to the segmentation step, when you specify the --input argument, you can drag and drop the folder where the images from the segmentation are stored. This will be the segmented_images folder created during the segmentation step. For example if the results from segmentation are in this location /home/johns_smith/results/segmentation/2024-07-12-09-05/segmented_images then your command line will look like the following:
granny -i cli --analysis color --input /home/john_smith/demo/results/segmentation/2024-07-12-09-05/segmented_images
Note
Remember, you can drag and drop a folder from the file browser into the terminal so you do not have to type the full directory path.
While running the color analysis, Granny will output something similar to the terminal:
input : (user) /home/john_smith/demo/results/segmentation/2024-07-12-09-05/segmented_images
Pear Color Rating Results
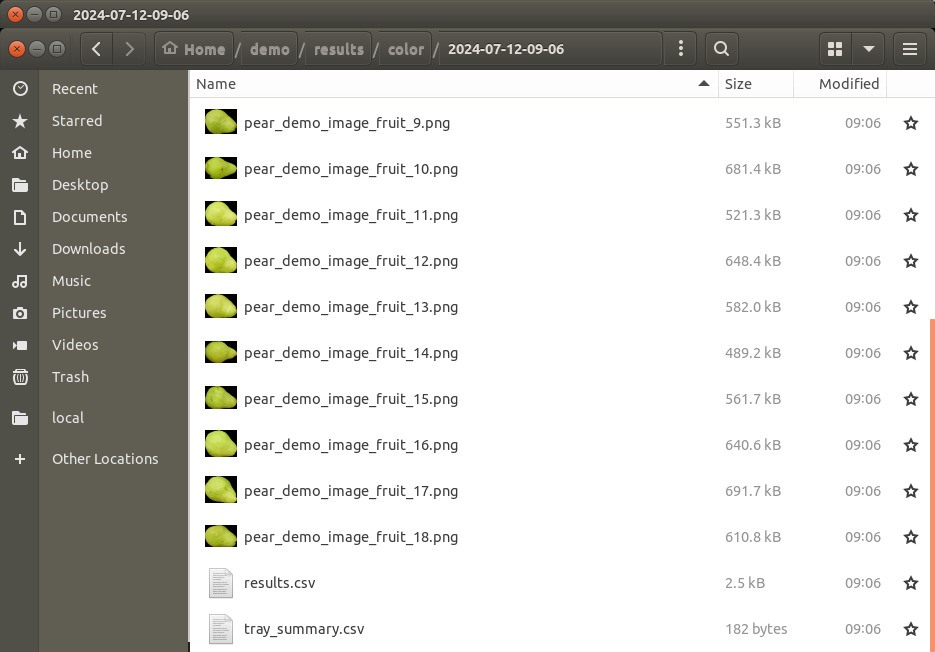
Similar to the segmentation step, a new folder named color will be created in the results results folder. It too will have a sub folder with the date the analysis was run. Inside this folder will be the results file named results.csv and images of each pear.
The results.csv file can be opened using Microsoft Excel or another spreadsheet program. The file includes the segmented image name and several rating values.
Name |
bin |
score |
distance |
location |
l |
a |
b |
TrayName |
|---|---|---|---|---|---|---|---|---|
Color_Example_1.png |
4 |
0.6703007385515274 |
2.5701832929087227 |
1.0 |
50 |
-26.322850395018868 |
76.7789415655696 |
Color_Example |
Color_Example_10.png |
4 |
0.6658633929849465 |
8.336352263952092 |
1.0 |
50 |
-29.02547515294169 |
82.9850348118263 |
Color_Example |
Color_Example_11.png |
4 |
0.6701374471676288 |
7.6367376298511465 |
1.0 |
50 |
-28.373025690812188 |
82.69782250378182 |
Color_Example |
Color_Example_12.png |
4 |
0.6535951040505874 |
3.133617071437941 |
1.0 |
50 |
-27.89406090871715 |
75.50936306035446 |
Color_Example |
Color_Example_13.png |
5 |
0.6753715959925888 |
4.051033110394391 |
1.0 |
50 |
-26.50410552291817 |
79.10878136026689 |
Color_Example |
Color_Example_14.png |
5 |
0.6741239184041659 |
1.312681760944373 |
1.0 |
50 |
-25.518211322376686 |
75.73441925043299 |
Color_Example |
Color_Example_15.png |
4 |
0.6480063978872677 |
8.455840692272304 |
1.0 |
50 |
-30.627408738199428 |
80.89491021813136 |
Color_Example |
Color_Example_16.png |
4 |
0.6537284317989162 |
6.677376066523931 |
1.0 |
50 |
-29.37904645402284 |
79.5760682422381 |
Color_Example |
Color_Example_17.png |
5 |
0.6909861423041394 |
2.2332073112137967 |
-1.0 |
50 |
-22.86260347145514 |
73.34407489560121 |
Color_Example |
Color_Example_18.png |
4 |
0.6546418725558671 |
2.537014665368667 |
1.0 |
50 |
-27.5586529873822 |
74.94729670831386 |
Color_Example |
Color_Example_2.png |
4 |
0.6696602613285434 |
3.17187455604699 |
1.0 |
50 |
-26.616243957896064 |
77.41020756921098 |
Color_Example |
Color_Example_3.png |
4 |
0.6533501374876826 |
1.5815309659830876 |
-1.0 |
50 |
-25.921479198243475 |
70.09372223218708 |
Color_Example |
Color_Example_4.png |
5 |
0.682138070900791 |
1.3652382736778739 |
-1.0 |
50 |
-23.853295848318478 |
73.44028702184062 |
Color_Example |
Color_Example_5.png |
4 |
0.644381792304141 |
7.286887678376137 |
1.0 |
50 |
-30.435995954170135 |
79.12515043398662 |
Color_Example |
Color_Example_6.png |
4 |
0.6540008067887495 |
1.053554640168655 |
1.0 |
50 |
-26.98415856291395 |
73.17727182437692 |
Color_Example |
Color_Example_7.png |
4 |
0.6585493622272056 |
3.2506899718181748 |
-1.0 |
50 |
-24.838122582834757 |
68.729236309785 |
Color_Example |
Color_Example_8.png |
4 |
0.6499018671623829 |
4.525019766465617 |
1.0 |
50 |
-28.785119627954426 |
76.66404584678685 |
Color_Example |
Color_Example_9.png |
4 |
0.6198036457425253 |
7.130207185838455 |
1.0 |
50 |
-32.46627873591814 |
75.93724145628157 |
Color_Example |
The following provides the meaning of each column in results.csv file:
Name: The name of the segmented image. A single pear is contained in each image.
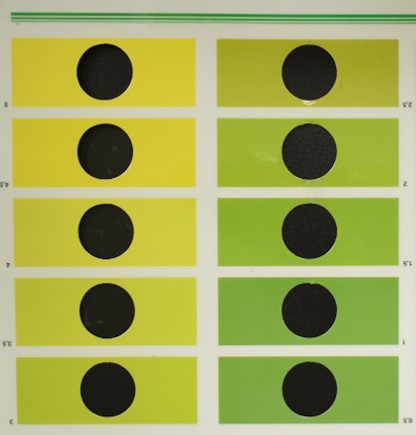
bin: Granny will estimate a color that best approximates the rating in the color card that is commonly used for pear color rating. An image of the color card can be found below.
score: The granny color score rating. The score ranges from 0 to 1, where 1 indicates more yellow fruit and lower numbers more greenish fruit. Formally, this score is the distance along the line that passes through the color card colors in LAB color space. Please see the published Granny manuscript for more detailed information about how this score is calculated.
distance: This value indicates the distance from the line that passes through the color card colors in LAB color space. Because the color card can not include the color of every pear, this number is meant to indicate how “off” the color might be from a traditional color card rating. The closer to 0 the less “off” it is.
location: Indicates if the distance value is above (1 value) or below (-1 value) the line.
l: The “L” channel value in the LAB color space.
a: The “A” channel value in the LAB color space.
b: The “B” channel value in the LAB color space.
TrayName: The name of the original tray image.
The following is an image of the color card that is commonly used to rate pear color. Each color on the card has a unique number from 0.5 (most green) to 5 (most yellow).
Granny’s pear color rating module will also report an average tray level color rating in the tray_summary.csv file.
TrayName |
bin |
score |
distance |
location |
l |
a |
b |
|---|---|---|---|---|---|---|---|
pear_demo_image_fruit |
4.22222222222222 |
0.660048942774391 |
4.28146103077064 |
0.555555555555556 |
50 |
-27.5796094195362 |
76.7010994738336 |